
The classic car market index is a quantitative measure of collector car market heat, momentum, and strength, giving investors and collectors a clear, data-backed snapshot of where the vintage automobile market stands at any given moment. The industry's leading example is the Hagerty Market Rating, a closed 0–100 scoring system that tracks market activity across thousands of transactions. Paired with the open-ended Hagerty Market Index, which behaves more like a stock index, these tools give you the clearest picture available for classic car market analysis. In 2026, both measures are signaling a market that is stable at the top but noticeably soft in the middle and lower tiers. Understanding what those signals mean is the difference between a smart buy and an expensive mistake.
How is the classic car market index calculated?
The Hagerty Market Rating runs on a closed 0–100 scale and measures market heat, momentum, and overall strength. The accompanying Hagerty Market Index is open-ended and modeled after traditional stock indices, so it can exceed 100 and tracks nominal price movement over time.
The data feeding these tools comes from multiple sources:
- Auction results from major sales events, including hammer prices and sell-through rates
- Private sale transactions tracked through Hagerty's insurance and valuation network
- Insured vehicle values across hundreds of thousands of collector cars
- Dealer and marketplace activity reflecting real-world buyer and seller behavior
One critical detail: Hagerty adjusts the Market Rating for inflation. That means inflation spikes cause rating drops even when nominal prices are rising. The Market Index, by contrast, tracks raw nominal values without inflation adjustment. This distinction matters enormously when you are trying to figure out whether demand is genuinely growing or just keeping pace with broader price increases.
Hagerty also tracks multiple sub-indices representing distinct vehicle cohorts, including Blue Chip classics, British Cars, Affordable Classics, Supercars, Trucks, and the RADindex for modern collectibles. Each sub-index uses a fixed basket of vehicles, which prevents the overall headline number from masking wildly different performance across segments. For additional context on used vehicle pricing methodology, Black Book publishes market indexes based on roughly two million vehicles using dealer-lot data and mix-adjustment techniques, though its focus skews toward 2–6 year old vehicles rather than true classics.
Pro Tip: Always check both the Market Rating and the Market Index together. One without the other gives you an incomplete picture of what is actually driving price movement.
What do 2026 classic car market trends show?
The 2026 collector car market is telling two very different stories depending on which segment you are watching. The headline numbers look stable, but the details reveal real softness beneath the surface.
In march 2026, the Hagerty Market Rating reached 59.01 with the Market Index sitting at 171.04. Those numbers sound healthy until you understand that the 50–60 range is defined as a flat market, meaning momentum is present but not strong. The Market Rating had stayed in that flat range for nearly a full year heading into spring 2026.
By may 2026, inflation added another layer of complexity. The inflation rate hit 0.64%, the highest in three years, which pushed the Market Rating down 0.23 points to 58.67 while the Market Index continued rising for its third consecutive month. That divergence is not a contradiction. It is the inflation adjustment doing exactly what it is designed to do.
"When buyers and sellers cannot agree on prices, it signals underlying softness beyond headline auction prices." — Hagerty Media
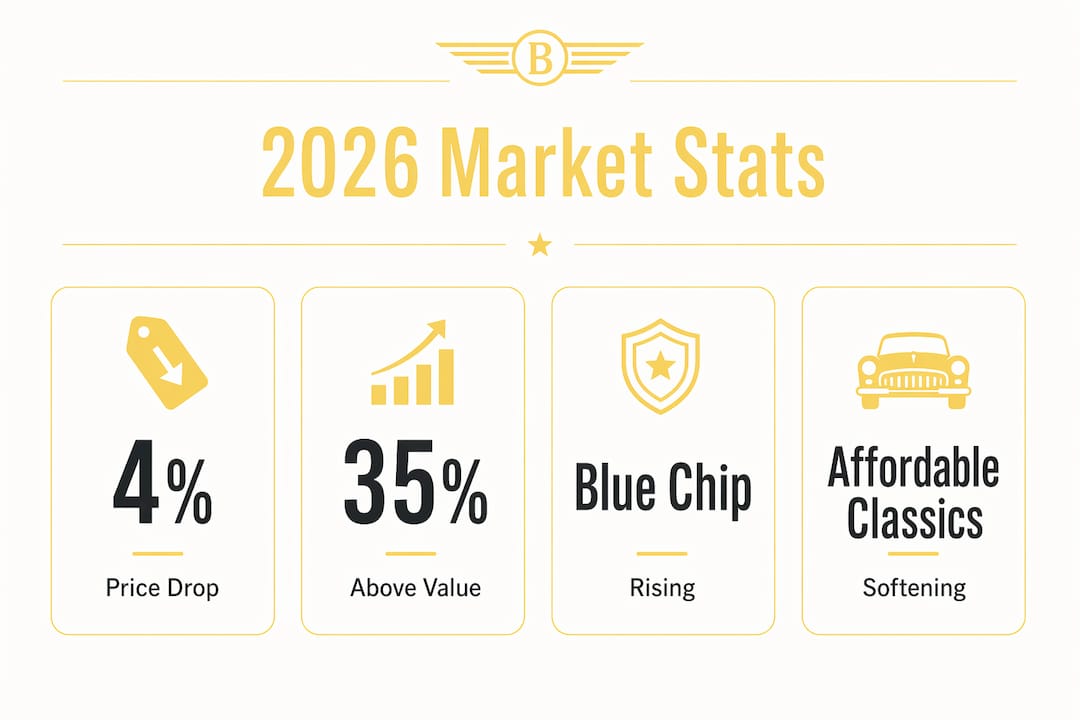
The bifurcation in the market is the most important trend of 2026. Globally, classic car prices fell 4% overall in Q1 2026, yet auction sell-through rates stabilized at 78% and volume actually increased for cars priced above £250,000 and under £10,000. The middle segment is where the stagnation lives.
| Metric | 2022 Peak | May 2026 |
|---|---|---|
| Cars selling above insured value | Over 50% | ~35% |
| Market Rating range | Above 60 | 58.67 |
| Market Index trend | Rising sharply | Rising modestly |
| Global price change (Q1) | Positive | Down 4% overall |
| Auction sell-through rate | High | Stabilized at 78% |
The drop in cars selling above insured value from over 50% in summer 2022 to roughly 35% in may 2026 is one of the clearest demand signals available. Fewer buyers willing to pay above insurance value means liquidity is tightening for the average collector car.
What can sub-indices tell you about market segments?
The classic car market is not monolithic. Treating it as one uniform asset class is one of the most common and costly mistakes investors make. Hagerty's sub-indices exist precisely to prevent that kind of overgeneralization.

Here is how the major segments compared in early 2026:
| Sub-Index | 2026 Trend | Key Characteristic |
|---|---|---|
| Blue Chip | Rising | Top-tier icons, strong demand |
| Supercars | Rising | High-value, liquid market |
| British Cars | Flat to soft | Cooling buyer interest |
| Affordable Classics | Soft | Price pressure, slower sales |
| Trucks | Stable | Consistent collector demand |
| RADindex | Mixed | Modern collectibles, volatile |
The Blue Chip and Supercar segments are carrying the headline numbers in 2026. Cars like Ferrari 250s, early Porsche 911s, and first-generation Ford GT40s are still attracting serious money at auction. These are the vehicles where sub-indices with fixed vehicle baskets show the clearest upward movement.
The Affordable Classics segment tells a different story. Buyers in the $20,000–$80,000 range are more sensitive to interest rates, inflation, and economic uncertainty. When macroeconomic pressure builds, this segment softens first and recovers last. British Cars, once a darling of the collector world, are facing additional headwinds from parts availability concerns and shifting generational tastes.
Understanding which sub-index applies to a car you are considering is not optional. It is the foundation of any serious classic car market analysis. A car sitting in a cooling segment requires a different risk assessment than one in a segment with strong liquidity and rising demand.
How should investors apply classic car market index data?
Knowing the index numbers is only half the job. Applying them correctly to real buying and selling decisions is where most collectors either win or leave money on the table.
Start with these core principles:
- Compare both indices together. A falling Market Rating alongside a rising Market Index almost always reflects inflation adjustment effects rather than a collapse in genuine demand. Panicking on that signal alone is a mistake.
- Track the percentage selling above insured value. This metric is one of the most reliable liquidity gauges available. When that number drops below 40%, as it did in may 2026, the market is telling you that buyers have more leverage than sellers. That is useful information whether you are buying or selling.
- Do not anchor to headline auction results. High-profile sales at Barrett-Jackson or RM Sotheby's capture attention, but top-tier auction results can be misleading if you treat them as representative of the broader market. Private sale data and insurance value comparisons give you a more accurate read on everyday demand.
- Match the sub-index to the car. Before buying, identify which Hagerty sub-index covers the vehicle you are evaluating. A car in the Blue Chip basket carries different risk and return expectations than one in the Affordable Classics basket.
- Use valuation methods alongside index data. Index readings tell you about market direction. Proper classic car valuation methods tell you whether a specific car is priced fairly within that market. You need both.
Pro Tip: Shifts in the percentage of cars selling above insured value often precede broader liquidity cycles. Watch that number monthly. It can give you a 60–90 day early warning before broader price moves show up in auction results.
The flat market reading of 2026 is not a reason to avoid the classic car market entirely. For investment-grade classic cars with strong fundamentals and clear segment demand, a flat market can actually be an ideal entry point. Prices are not running away from you, and motivated sellers are more common than they were in 2022.
Key takeaways
The classic car market index, led by the Hagerty Market Rating and Market Index, measures market heat and momentum across distinct segments, and reading both together with sub-index data is the only reliable way to make informed investment decisions in 2026.
| Point | Details |
|---|---|
| Index construction matters | The Hagerty Market Rating is inflation-adjusted; the Market Index is nominal. Use both together for a complete read. |
| Flat market in 2026 | A Market Rating of 58–59 signals low momentum, not collapse. Top-tier segments are still performing well. |
| Liquidity is the real signal | Only ~35% of cars sold above insured value in May 2026, down from 50%+ in 2022. That gap measures real demand softness. |
| Segmentation is non-negotiable | Blue Chip and Supercar sub-indices are rising while Affordable Classics and British Cars are cooling. Treat each segment separately. |
| Inflation distorts the headline | A falling Market Rating with a rising Market Index means inflation is at work, not a fundamental demand crash. |
What the index tells you that most collectors miss
I have watched collectors make the same mistake for years. They see a Ferrari hammer for a record price at Pebble Beach, and they assume the whole market is on fire. The Hagerty Market Rating exists specifically to correct that kind of thinking.
The index data for 2026 is actually one of the more interesting readings I have seen in a while. A Market Rating stuck in the 58–59 range for nearly a year is not exciting on the surface. But when you layer in the sub-index performance, you see something more nuanced. The top of the market is genuinely healthy. Blue Chip cars with provenance, matching numbers, and documented history are still attracting serious competition. The softness is concentrated in the middle, where buyers have become selective and sellers are sometimes reluctant to accept where prices have settled.
The inflation adjustment piece is the part most investors get wrong. When the Market Rating drops while the Market Index rises, the instinct is to worry. The correct response is to recognize that nominal prices are holding or rising, and the rating drop is a mathematical consequence of the inflation adjustment. That is a very different situation from a market where buyers are simply walking away.
My honest advice for 2026: focus on cars with clear sub-index support, track the percentage selling above insured value every month, and do not let a flat headline number talk you out of a well-priced Blue Chip car. The insurance value versus sale price relationship is your best real-time demand gauge. Use it.
— Tony
Find your next classic with Butterclassics
Understanding the classic car market index is the foundation. Finding the right car to act on that knowledge is the next step.
Butterclassics specializes in investment-grade classic and vintage vehicles, from Blue Chip muscle cars to iconic Corvettes, Broncos, and trucks. Every car in the Butterclassics inventory is sourced with serious collectors and investors in mind. You get detailed specs, high-quality photos, and the kind of transparency that makes a confident purchase feel smooth as butter. Whether you are ready to buy or just starting to build your shortlist, browse the full inventory or explore the Butter Certified collection for vehicles that meet the highest quality standards. Your next great classic is waiting.
FAQ
What is the hagerty market rating?
The Hagerty Market Rating is a closed 0–100 score that measures collector car market heat, momentum, and strength. A rating of 50–60 indicates a flat market with low momentum, while scores above 70 signal strong buyer activity.
How does inflation affect the classic car market index?
Hagerty adjusts the Market Rating for inflation, so a spike in inflation can push the rating down even when nominal prices are rising. Comparing the inflation-adjusted Market Rating against the nominal Market Index together reveals whether price changes reflect real demand or just inflation.
What does it mean when few cars sell above insured value?
When fewer than 40% of classic cars sell above their insured value, it signals softening buyer demand and reduced market liquidity. In may 2026, that figure sat at roughly 35%, compared to over 50% during the 2022 market peak.
Why do classic car sub-indices matter for investors?
Sub-indices like Hagerty's Blue Chip, Affordable Classics, and RADindex track distinct vehicle cohorts separately, preventing a strong top-tier performance from masking weakness in other segments. Matching a car to its relevant sub-index gives you a far more accurate risk and return picture than any headline number alone.
What is a good classic car market rating for buying?
A Market Rating in the 50–60 flat market range can actually be a favorable entry point for buyers. Prices are stable, motivated sellers are more accessible, and top-tier cars with strong fundamentals are available without the premium that comes during a hot market above 70.