
If you've ever looked at a 1969 Chevrolet Camaro Z28 rated at 290 horsepower and thought, "That seems low for a performance legend," you're already bumping into one of the most misunderstood topics in the classic car world. The role of horsepower ratings in vintage cars goes far deeper than a single number on a window sticker. Those figures were shaped by testing methods, marketing strategies, insurance politics, and government regulation, and understanding that context is what separates a savvy collector from someone who overpays or undersells.
Here's what you need to know upfront:
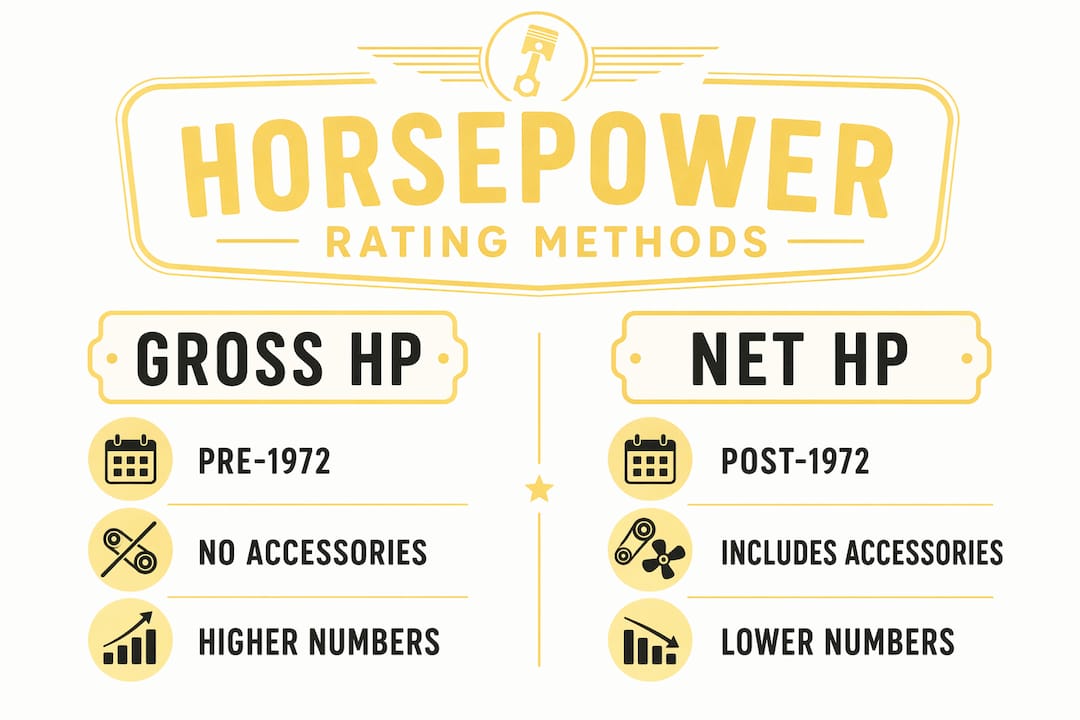
- Gross horsepower was the standard before 1972, measured on a test stand with no air cleaner, no restrictive exhaust, and no power-robbing accessories like alternators or power steering pumps. Numbers looked great on paper.
- Net horsepower replaced gross ratings starting with the 1972 model year, measured with all production accessories installed, reflecting what the engine actually produced in a real car.
- A rough conversion between the two is often estimated at around 0.80 times the gross figure, though the actual ratio varies depending on the engine and its accessories.
- Factory ratings were sometimes deliberately manipulated, either underrated to satisfy racing classes or insurance underwriters, or inflated to win showroom traffic.
- For collectors, the rating method matters as much as the number itself when comparing pre-1972 and post-1972 cars or assessing investment-worthy classic cars.
Raw horsepower numbers without context are like a restaurant menu without prices. They tell you something, but not the whole story.
Table of Contents
- How horsepower rating methods evolved over the decades
- Why vintage horsepower numbers don't always match real-world performance
- The 1971 vs. 1972 horsepower shift and what it means for collectors
- How to realistically evaluate vintage car horsepower as a collector
- Key Takeaways
How horsepower rating methods evolved over the decades
Understanding vintage car horsepower starts with knowing how engineers actually measured it, and how those methods shifted over time.
Early measurement and dynamometer types
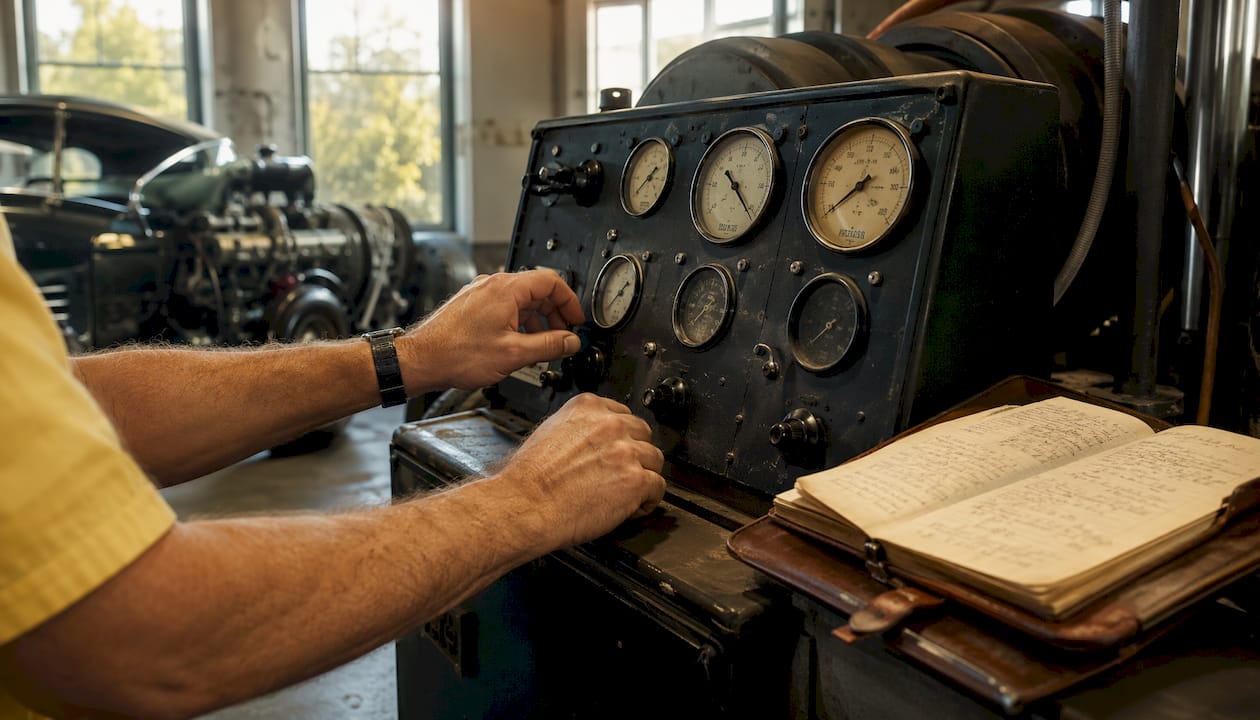
In the vintage era, horsepower was measured using engine dynamometers that attached directly to the crankshaft. These brake dynamometers, sometimes called water brake dynos, measured the torque required to resist the engine's rotation under load. Jay Leno's garage famously uses a Superflow SF-902 water brake engine dyno, a direct descendant of the type used in period factory testing. Chassis dynamometers, which measure power at the drive wheels, came later and consistently show lower numbers because drivetrain losses eat into output between the crankshaft and the pavement.
The critical difference was what got attached to the engine during the test. Gross horsepower testing stripped the engine down to its most favorable configuration: no air cleaner, open exhaust headers, and no accessories. Net testing bolted everything back on.
Key milestones in horsepower rating history
- Pre-1971: SAE gross horsepower dominates. Engines are tested in idealized lab conditions, producing the highest possible numbers. Manufacturers use these figures in all advertising.
- 1970: California passes legislation requiring automakers to advertise only SAE net horsepower, citing consumer transparency concerns.
- 1971: A transitional year. GM and Chrysler begin publishing both gross and net figures side by side. Ford largely sticks with gross ratings. Buyers who wanted bragging rights still gravitated toward the gross number.
- 1972: The 1972 California law takes full effect, and Detroit's Big Four adopt net horsepower across the board rather than maintain separate figures for California and the rest of the country.
- SAE J1349: This standard formalizes net horsepower testing procedures, becoming the benchmark that modern manufacturers still reference today.
- SAE J2723 (2005): SAE tightens certification requirements further, requiring third-party verification of horsepower claims. This is why modern horsepower figures are generally more reliable than anything from the muscle car era.
The emissions regulations of the early 1970s added another layer of complexity. Compression ratios dropped to accommodate lower-octane unleaded fuel, and smog equipment added mechanical drag. So when a 1972 Corvette appeared to lose horsepower compared to its 1971 sibling, two things happened simultaneously: the rating method changed, and the engine itself was genuinely detuned. Separating those two effects is something collectors still wrestle with today.
Why vintage horsepower numbers don't always match real-world performance
A number on a spec sheet and what you feel through the seat of your pants are two different conversations. Vintage car performance ratings were never the complete picture, and here's why.
The accessories problem
Gross horsepower testing removed every accessory that consumed engine power. In the real world, your alternator, power steering pump, air conditioning compressor, and cooling fan all take a cut. For example, a 1970 Corvette rated at 370 gross horsepower produced significantly less net horsepower with everything installed, demonstrating a meaningful gap that grew wider on cars with more accessories.
Torque, weight, and the full picture
Horsepower alone doesn't win races. Torque delivery, power-to-weight ratio, and where in the RPM range the engine makes its power all matter enormously. A big-block muscle car with a fat torque curve at low RPM can feel dramatically quicker in everyday driving than a high-revving engine with similar peak horsepower numbers. The 426 Hemi's reputation wasn't built on its peak horsepower figure alone; it was built on an avalanche of torque that arrived early and stayed.
Real-world performance factors that horsepower ratings miss entirely:
- Gearing and rear axle ratio: A numerically higher axle ratio multiplies torque at the wheels, dramatically affecting acceleration.
- Vehicle weight: A lighter car with 300 horsepower beats a heavier car with 350 horsepower in most real-world scenarios.
- Transmission type and shift points: A well-tuned automatic or a close-ratio four-speed changes the performance equation completely.
- Tire compound and contact patch: Period bias-ply tires couldn't put down the power that modern radials can, making vintage quarter-mile times look slower than the horsepower figure might suggest.
Pro Tip: When evaluating a vintage car's real performance, look up its original quarter-mile trap speed rather than the advertised horsepower. Trap speed reflects actual kinetic energy and is much harder to manipulate than a dyno figure taken under controlled conditions. Experts consistently point to quarter-mile trap speeds as the most honest performance benchmark for vintage vehicles.
The 1971 vs. 1972 horsepower shift and what it means for collectors
No single event in American automotive history caused more confusion among collectors than the switch from gross to net horsepower ratings. Some cars appeared to lose up to 130 horsepower overnight without a single internal engine change. That's not an exaggeration.
The switch from gross to net ratings alone accounted for a noticeable apparent power reduction, independent of any mechanical changes. But in many cases, mechanical changes happened at the same time: lower compression ratios, air injection pumps, and exhaust gas recirculation systems all genuinely reduced output. The two effects stacked on top of each other, making the early 1970s look like a catastrophic performance collapse when the reality was more nuanced.
Gross vs. net horsepower: iconic engines compared
| Engine | Gross HP (pre-1972) | Net HP (1972 rating) | Apparent Loss |
|---|---|---|---|
| — | 330 hp | 275 hp | 55 hp |
| — | 400 hp (1970) | — | 165 hp |
| — | 425 hp | 350 hp | — |
The Cadillac 500 example is the most dramatic. Its apparent 165-horsepower drop included both a compression ratio reduction in 1971 and the rating method change in 1972. The Corvette LT1's 55-horsepower drop, by contrast, was largely a measurement artifact on an engine that changed very little mechanically.
What this means when you're buying
If you're comparing a 1971 muscle car to a 1972 model of the same nameplate, you cannot use the advertised horsepower figures as a direct apples-to-apples comparison. The 1971 car's gross figure and the 1972 car's net figure are measuring different things under different conditions. A 1971 car rated at 330 gross horsepower and a 1972 car rated at 275 net horsepower might be nearly identical performers in the real world. Understanding classic car grading and how to interpret period documentation is essential before making any valuation judgment based on spec sheets alone.
How to realistically evaluate vintage car horsepower as a collector
Factory ratings were never purely engineering documents. They were also marketing tools, insurance management instruments, and sometimes competitive strategy. Knowing that changes how you read them.
The politics behind the numbers
Factory horsepower ratings were sometimes deliberately manipulated for reasons that had nothing to do with accurate measurement. The Camaro Z28's 290-horsepower rating is a well-known example of deliberate underrating, as explained by Bavarian Autohaus's premium consignment services that emphasize authenticity and performance in classic cars. The actual output was significantly higher, but GM kept the number low to satisfy SCCA racing class restrictions and keep insurance premiums manageable for buyers. Chrysler's 426 Hemi was rated at 425 gross horsepower for years, a figure many Mopar enthusiasts believe was itself conservative.
On the other side, some manufacturers inflated ratings to win showroom battles. When every competitor was claiming 400-plus horsepower, there was real commercial pressure to match those numbers regardless of what the dyno actually showed.
Key factors that influenced whether a factory rating was accurate, underrated, or inflated:
- Racing class eligibility: Keeping a rating below a class threshold gave factory-backed teams a competitive advantage.
- Insurance pressure: Higher horsepower ratings drove up premiums for buyers, which hurt sales. Underrating kept costs down.
- Marketing competition: The horsepower wars of the 1960s created pressure to match or beat competitor claims.
- Dyno test conditions: Engine dyno results are sensitive to conditions, including how accessories are configured and environmental factors, giving manufacturers room to optimize their test setup.
No universal conversion formula exists
There is no precise formula to convert a gross horsepower figure to a net equivalent. The conversion varies from engine to engine, depending on the accessories installed and the engine's design. The commonly cited 0.80 multiplier is a useful starting point, not a reliable answer.
Statistic to know: The switch from gross to net ratings alone produced an apparent 15–25% power reduction in vintage cars, separate from any real mechanical detuning caused by emissions equipment or compression ratio changes.
Better metrics for collector decisions
When you're evaluating a vintage car's actual performance capability, these indicators tell you more than the window sticker ever will:
- Period road test quarter-mile times and trap speeds from publications like Car and Driver, Motor Trend, or Road & Track reflect real-world performance under real conditions.
- Power-to-weight ratio calculated from the car's actual curb weight gives a more honest comparison across models and eras.
- Torque curve shape, not just peak torque, determines how the car feels to drive in normal conditions.
- Engine configuration authenticity: A numbers-matching engine in its original state is a more reliable performance reference than a rebuilt or modified unit.
For collectors thinking about how performance attributes affect investment value, the combination of documented period performance data and mechanical authenticity carries far more weight than the advertised horsepower figure alone. A classic car test drive with attention to throttle response, power delivery, and drivetrain feel will tell you things no spec sheet can.
Key Takeaways
Gross horsepower ratings from the pre-1972 era consistently overstated real-world engine output, making direct comparisons with post-1972 net-rated cars unreliable without understanding the measurement context.
| Point | Details |
|---|---|
| Gross vs. net gap | Pre-1972 gross ratings ran noticeably higher than net figures for the same engine under installed conditions. |
| 1972 was the turning point | California's advertising law ended gross horsepower ratings; all U.S. manufacturers adopted net figures for the 1972 model year. |
| Ratings were sometimes manipulated | Factories underrated engines for racing class eligibility and insurance reasons, or inflated them for marketing purposes. |
| No exact conversion exists | The gross-to-net multiplier is often estimated at around 0.80, but actual values can vary roughly from 0.75 to 0.85 depending on engine configuration and accessories. |
| Real performance needs real data | Quarter-mile trap speeds and power-to-weight ratios are more reliable collector benchmarks than advertised horsepower figures. |
Ready to find a classic that lives up to its legend? At Butterclassics, we love helping enthusiasts cut through the noise and find the real deal. Browse our curated classic car inventory or explore our Butter Certified vehicles for cars that have been thoroughly vetted so you can buy with confidence.